Home

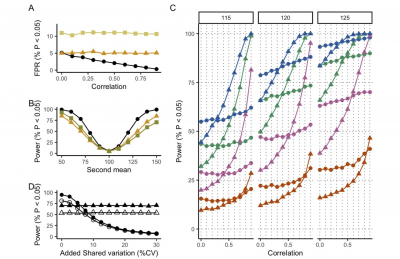
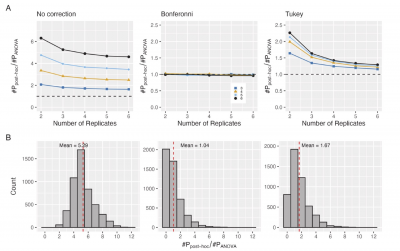
My research is focused on identifying the most appropriate statistical methods to analyze common wet-lab experiments in fields like biochemistry, cell biology, immunology, and physiology. I make models that include realistic sources of experimental variability, and use Monte-Carlo simulations to identify which statistical methods perform best.

Six-panel figure comparing the ratio of post-hoc test false-positive rate to ANOVA false-positive rate across different multiple-comparison corrections. The top row shows line plots for 2 to 6 replicates. With no correction, the post-hoc/ANOVA false-positive ratio is consistently above 1 and decreases as replicate number increases, with higher ratios when more treatment groups are compared. With Bonferroni correction, the ratio stays close to 1 across all replicate numbers and group counts. With Tukey correction, the ratio is above 1 but declines toward 1 as replicate number increases. The bottom row shows histograms of the same ratio across simulations. The no-correction distribution is centered far above 1, with a mean of about 5.29. The Bonferroni distribution is centered near 1, with a mean of about 1.04. The Tukey distribution is moderately above 1, with a mean of about 1.67. Dashed vertical red lines mark the mean values. Overall, the figure shows that uncorrected post-hoc testing greatly inflates false positives relative to ANOVA, Bonferroni correction keeps false positives close to the ANOVA rate, and Tukey correction produces moderate inflation that decreases with more replicates.

Six-panel figure comparing the ratio of post-hoc test false-positive rate to ANOVA false-positive rate across different multiple-comparison corrections. The top row shows line plots for 2 to 6 replicates. With no correction, the post-hoc/ANOVA false-positive ratio is consistently above 1 and decreases as replicate number increases, with higher ratios when more treatment groups are compared. With Bonferroni correction, the ratio stays close to 1 across all replicate numbers and group counts. With Tukey correction, the ratio is above 1 but declines toward 1 as replicate number increases. The bottom row shows histograms of the same ratio across simulations. The no-correction distribution is centered far above 1, with a mean of about 5.29. The Bonferroni distribution is centered near 1, with a mean of about 1.04. The Tukey distribution is moderately above 1, with a mean of about 1.67. Dashed vertical red lines mark the mean values. Overall, the figure shows that uncorrected post-hoc testing greatly inflates false positives relative to ANOVA, Bonferroni correction keeps false positives close to the ANOVA rate, and Tukey correction produces moderate inflation that decreases with more replicates.

Adam Zweifach
Professor and Department Head
adam.zweifach@uconn.edu
860-486-1627
University of Connecticut
Department of Molecular and Cell Biology
91 North Eagleville Road, Unit 3125
Storrs, CT 06269